
Key Points
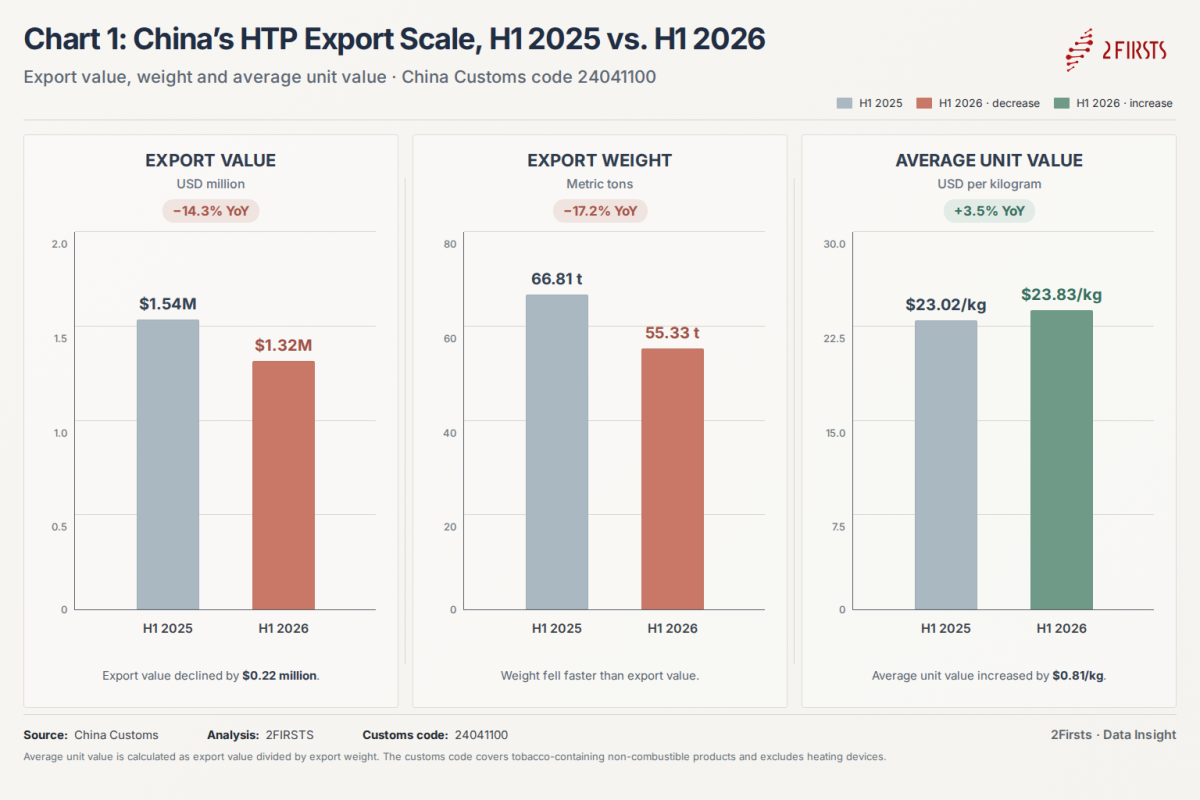
- Export value fell 14.3% to $1.32 million; export weight declined 17.2%
- Average export unit value rose 3.5% to $23.83 per kilogram
- Russia and Belarus accounted for $1.00 million, or 76.0% of total export value
- Yunnan ranked first by place of registration; Anhui and Sichuan recorded no exports
2Firsts, Shenzhen
August 11, 2026
China exported $1.32 million of products classified under customs code 24041100 — “products containing tobacco or reconstituted tobacco intended for inhalation without combustion” — in the first half of 2026, down 14.3% from $1.54 million a year earlier, Chinese customs data showed.
Export weight fell 17.2% to 55.33 metric tons from 66.81 metric tons. Average export unit value, calculated by dividing value by weight, rose 3.5% to $23.83 per kilogram from $23.02. The larger decline in weight than in value therefore reflected a modest increase in average unit value.
The contraction was not evenly distributed across destinations. Higher exports to Russia and Belarus offset part of the decline in Asian and other European destinations, producing a much more concentrated destination mix within a year.
Belarus Exports Rose 177.5% as Russia and Belarus Reached 76% Share
Belarus was the largest recorded destination in the first half of 2026. Export value rose 177.5% to $660,635, representing 50.1% of the total, while export weight increased 104.2% to 33.82 metric tons.
Russia ranked second, with export value up 57.9% to $341,615, or 25.9% of the total. Export weight to Russia rose 16.3% to 13.62 metric tons.
Combined exports to the two countries increased to $1.00 million from $454,386 a year earlier. Their share climbed 46.5 percentage points to 76.0% from 29.5%. The $547,864 increase in exports to Russia and Belarus offset part, but not all, of the decline in other destinations.
The figures identify the immediate destinations recorded by Chinese customs. They do not show whether goods were later re-exported and should not be treated as measures of retail sales or end-market consumption in either country.
Philippines, Singapore and Indonesia Share Fell to 11.2% From 49.3%
Exports to the Philippines, Singapore and Indonesia all fell sharply in contrast with growth in Russia and Belarus.
Export value to the Philippines dropped 84.7% to $39,368 from $257,874. Singapore fell 63.1% to $108,669 from $294,185, while Indonesia declined 99.9% to $303 from $205,810.
The three destinations together accounted for $148,340, or 11.2% of total export value, down from $757,869 and 49.3% a year earlier. Romania and Lithuania, which recorded exports of $133,077 and $3,145 respectively in the first half of 2025, recorded none in the same period of 2026.
Customs data alone cannot establish whether the declines resulted from end-market demand, inventory adjustments, order timing, customs declaration timing, trade routes or company-level decisions. Recorded destinations, particularly trading hubs such as Singapore, should not be read as direct measures of local consumption.

China’s HTP Exports Fell to Zero in February Amid Sharp Batch-Driven Volatility
China’s exports of heated tobacco products under customs code 24041100 showed pronounced monthly volatility in the first half of 2026. Export value peaked at $363,800 in January, followed by $318,700 in April and $287,700 in March. It fell to $156,100 in May before recovering to $192,000 in June, while February exports were zero.
February coincided with the Lunar New Year holiday in China, which may have affected production, logistics and customs-clearance schedules. However, the holiday alone does not fully explain the fluctuations during the period. China recorded exports in every month of the first half of 2025, while the corresponding 2026 customs dataset contained only 14 aggregated records categorized by month, destination, trade mode and exporter registration location. The limited number of records indicates relatively few export batches, meaning the declaration timing of a single large order could materially affect the monthly figures.
Overall, China’s HTP exports were unstable and strongly batch-driven in the first half of 2026. The February decline to zero may have been partly related to the Lunar New Year holiday, but the limited dataset does not establish an interruption in end-market demand. Individual monthly movements should therefore not be interpreted as evidence of a sustained market trend.
Yunnan Rose 63% to Rank First; Jiangsu and Shanghai Entered as Anhui and Sichuan Recorded No Exports
The distribution by registered location within China also shifted. Exporters registered in Yunnan recorded $518,905 in the first half of 2026, up 63.0% and equal to 39.4% of the national total, overtaking Hunan to rank first.
Hunan recorded $424,077, up 15.1%, and accounted for 32.2%. Jiangsu and Shanghai recorded $234,440 and $101,235 respectively, representing 17.8% and 7.7% of the total and placing them among the leading registration locations for the period.
Hubei’s export value fell 81.2% to $39,368 from $209,787. Anhui and Sichuan, which recorded $333,749 and $233,400 respectively in the first half of 2025, recorded no exports in the same period of 2026.
The customs field for place of registration does not necessarily identify where a product was manufactured. Provincial data alone cannot establish which companies produced the exported goods or attribute the value to a particular provincial tobacco industry company.
Russia and Belarus Share Rose 46.5 Percentage Points, Increasing Sensitivity to Fewer Destinations
The first-half figures show two developments occurring at the same time: export value and weight declined, while the destination mix became heavily concentrated in Russia and Belarus.
Growth in the two destinations provided the principal support to exports during the period. But their combined 76.0% share also means changes in order size, declaration schedules or trade routes involving either destination would have a greater effect on China’s aggregate export figures than a year earlier.
The sharp decline in the combined share of three major Asian destinations, together with changes in domestic registration locations, points to continued volatility in the export structure. February’s zero reading and the small number of aggregated entries provide insufficient evidence that exports of the covered HTP consumables have entered a stable growth phase supported by multiple destinations.
Customs Code Covers Tobacco-Containing HTP Consumables, Not Heating Devices
The analysis is based on Chinese customs code 24041100, covering “products containing tobacco or reconstituted tobacco intended for inhalation without combustion.” It primarily captures tobacco-containing HTP consumables. It excludes electronic heating devices and may not include non-tobacco substrates or related products declared under other codes.
“China’s HTP exports” in this article therefore refers only to products captured by this customs classification, not China’s complete exports of HTP devices and related products. Year-on-year changes and shares were calculated by 2Firsts using unrounded customs data; displayed figures have been rounded where appropriate.
2Firsts provides ongoing coverage of market shifts, regulatory developments, product innovation and supply-chain dynamics across the global next-generation products (NGPs) industry. Follow 2Firsts for timely industry intelligence and in-depth analysis.
Cover Image generated by AI
Disclaimer
This article is provided solely for professional research, industry discussion, and informational purposes. Any references to brands, companies, products, technologies, or policies are made for factual reporting and analytical purposes only, and do not constitute endorsement, recommendation, promotion, or advertising by 2Firsts.
Nicotine-containing products, including but not limited to cigarettes, e-cigarettes, heated tobacco products, and nicotine pouches, carry significant health risks. Readers are responsible for complying with all applicable laws and regulations in their respective jurisdictions, including age restrictions and access limitations.
The information contained in this article should not be regarded as investment, legal, medical, regulatory, or commercial advice. While 2Firsts strives to ensure the accuracy and reliability of its content, it does not assume liability for any direct or indirect loss arising from errors, omissions, inaccuracies, or reliance on the information contained herein.
This article is not intended for individuals below the legal age for accessing tobacco or nicotine-related information in their jurisdiction.
Copyright Notice
This article is either original content produced by 2Firsts or content reproduced, translated, summarized, or adapted from third-party sources with attribution where applicable. The intellectual property rights of the original content remain with 2Firsts or the respective original rights holders.
No individual or organization may copy, reproduce, distribute, republish, modify, translate, or otherwise use this content without prior authorization. Any unauthorized use may result in legal action.
For copyright-related inquiries, corrections, or removal requests, please contact: info@2firsts.com.
AI-Assisted Translation and Editing Notice
Portions of this article may have been translated, edited, or reviewed with the assistance of artificial intelligence tools to improve efficiency and readability. Due to the limitations of AI-assisted translation and editing, discrepancies, omissions, or inaccuracies may exist when compared with the original source.
Where applicable, readers are advised to refer to the original source for the most complete and accurate information. If you identify any errors or believe that any content infringes upon your rights, please contact us at info@2firsts.com, and we will review and address the matter promptly.